Daily Weather Charts
When towers
and castles build in the sky,
Bring in the laundry you intended to dry.
Weather
Folklore
 As
a National Weather Service
SKYWARN® storm spotter located in Priceville, Alabama, I like
to keep a close eye on the weather, especially when severe weather is
in the forecast. For those days, I created this web page, together
with the smaller "mini
version" and the even smaller "micro
version." The intent is to give me an amateur's "map
room" for north Alabama.
As
a National Weather Service
SKYWARN® storm spotter located in Priceville, Alabama, I like
to keep a close eye on the weather, especially when severe weather is
in the forecast. For those days, I created this web page, together
with the smaller "mini
version" and the even smaller "micro
version." The intent is to give me an amateur's "map
room" for north Alabama.
Right: The "Map
Wall" in the Meteorology
Dept., University Park Campus, Penn State University.
However, this is not a
map room in the conventional sense, since it is not my intent to make
a weather forecast. Instead, the purpose of this page is to answer
two questions: (1) Will
today be a severe weather day? (2) If
so, what, where and when?
Many of these maps look
well to my west. The average cold front can cover
720 miles in a day (the distance to Russell, KS), but a fast-moving
cold front can cover that distance in 12 hours. Knowing what the weather will be in the next few days
gives me the extra time I need to plan and prepare for potentially
severe weather. Be Prepared!
Today is
This free script provided by
JavaScript
Kit
Graphical
Weather Forecast
National and Local Radar
Severe/Hazardous Weather,
Huntsville
Office, National Weather
Service
Storm Prediction Center, NCEP,
NWS
Weather Station at 24 Willow Place:
KALDECAT4
Weather
Station at
Pryor
Field, Decatur, AL
Last Three Days
|
Meteogram
|
Contents
Current Conditions
Radar Images
Satellite Images
Surface and Upper
Air Maps
National
Temperatures, Dew Points, and Theta-E
Soundings Charts
Mesoscale
Analysis and Discussions
Watch, Warnings and
Advisories Map
Convective
Outlook, Thunderstorms and Tropical Cyclones
National Forecast Products
Local Forecast Products
Other Severe Weather
Day Resources
A URL for
this page: http://tinyurl.com/6hwnh2
|
Current Conditions
Current
Conditions-Willow Place
Current Weather in Priceville, AL (Cumulus)
KALDECAT4
| CW7715
| PWS Weather
Conditions
& Forecast - Pryor Field, Decatur, AL
Watches
& Warnings for
Morgan
Co., Alabama
Local TV Weather & News
Priceville
Weather Webcam (inclement wx only)
Weather - First Look
Graphical Weather Forecast
National and Local Radar
Weather
Models and Forecasts
Quick
Text Links
Hazardous
Weather Quick Look
Severe/Hazardous
Weather,
Huntsville
Wx Forecast Office
National
Weather Service
Storm
Prediction Center, NCEP, NWS
College of DuPage
NexLab
Heat: The Major Weather Killer
|
Heat is the number one weather-related killer in the
United States.
Based on the 10-year average from 2000 to 2009, excessive
heat claims an average of 162 lives a year. By contrast, hurricanes killed 117;
floods 65; tornadoes, 62; and lightning, 48. The National Weather Service has
a web page to help individuals and communities plan for and
deal with the dangers of heat.
For more information, point your browser to
Heat: A
Major Killer.
Go To Top
Current
Conditions

Source:
Current
Conditions,
The
Weather Channel
Other
Surface Maps
Current
Conditions, Hydrometeorological
Prediction Center, NCEP, NWS
24-hour
Current Conditions Loop - Hydrometeorological
Prediction Center
Fronts/Analysis:
North
America | CONUS -
Hydrometeorological
Prediction Center, ,
Hydrometeorological
Prediction Center (HPC), National
Centers for Environmental Prediction (NCEP), National
Weather Service (NWS),
National Oceanic and
Atmospheric Administration (NOAA),
US Department of Commerce
Analysis/Satellite
Composite (North America) - Hydrometeorological
Prediction Center, NCEP, NWS
Analysis/Satellite
Composite (N Amer/Pacific) - Hydrometeorological
Prediction Center, NCEP, NWS
GOES
E & W Satellite Composite - Hydrometeorological
Prediction Center, NCEP, NWS
North
American Surface Analysis Products, NCEP,
NWS
North
America Surface Analysis (Loop),
HPC, NCEP, NWS
Isobars,
Fronts, Radar & Data, American
Meteorological Society
Southeast
Fronts Surface Map,
WAAY-TV
Current
Frontal Analysis Plot (Inverted), Unisys
Build
Your Own Weather Map and Forecast
Tools, Storm Prediction Center (SPC), NWS
Daily Weather Map
Weekly
PDF Files
Current
Surface Webpage,
RAP Real-Time Weather Data, National
Center for Atmospheric Research (NCAR)
,
University Corporation for Atmospheric Research (UCAR)
Go To Top
Radar
Images
US
National Radar
Source:
Storm Prediction
Center, NCEP, NWS
If
there is a notation "See Text," refer to the text messages
at Day
One Convective Outlook.
See also: AccuWeather.com
Enhanced Radar
Lower
Mississippi Valley Sector Radar

Additional
NWS Radar Links
Southeast
Sector | Loop
Lower Mississippi Valley Sector | Loop
Upper
Mississippi Valley Sector | Loop
South
Plains Sector | Loop
Pacific
Northwest Sector |
Loop
Source:
National
Doppler Radar Site, National Weather Service
Also:
Weather.com SE US Radar
Hytop,
Alabama

|

|
= Tornado Vortex Signature
|
|

|
= Mesocyclone
|
|

|
= Hail
|
Source:
Hytop Radar
Image for north Alabama, Weather
Underground
Decatur-Priceville
Close-up Loop: Decatur Radar
NWS Radar Loop from Huntsville, NWS
Hytop
(Alabama)
|
Hytop
Radar Loop,
National Weather Service
Huntsville
Radar, College of DuPage, Next Generation Weather Lab, Main
Analysis Page
(multiple
views of reflectivity and velocity)
ARMOR
(Advanced Radar for Meteorological and Operational Research) at UAH:
http://vortex.nsstc.uah.edu/armor/webimage/
Note:
ARMOR Data is now available as a Google Earth overlay. Google Earth®
software required.
National and Local
Radar
North Central Alabama Weather Radars
Channel 19 Weather Page
Channel 19 Armor Doppler Radar Loop
Channel 31 Radar Loop
Channel 48 Live Doppler Radar Loop
Weather Underground Animated Radar Loop for
Northern Alabama
Additional
Radar
Huntsville
and
Regional
Weather Map,
Weather Underground
Hytop
(Alabama)
|
Hytop
Radar Loop,
National Weather Service
Columbus
Air Force Base
(Mississippi),
National Weather Service
Southern
Mississippi Valley Sector Mosaic,
National
Weather Service
National
Radar Mosaic, National Weather Service
NEXRAD
for HSV
/ Regional
NEXRAD for SE US
Satellite
/ Severe
/ Tornado
/ Hurricane
Alabama
- Next Generation Weather Lab, College of DuPage
National
Radar | National
Satellite | SE
US Radar | SE
US Satellite - Source: NBC WeatherPlus
Go To Top
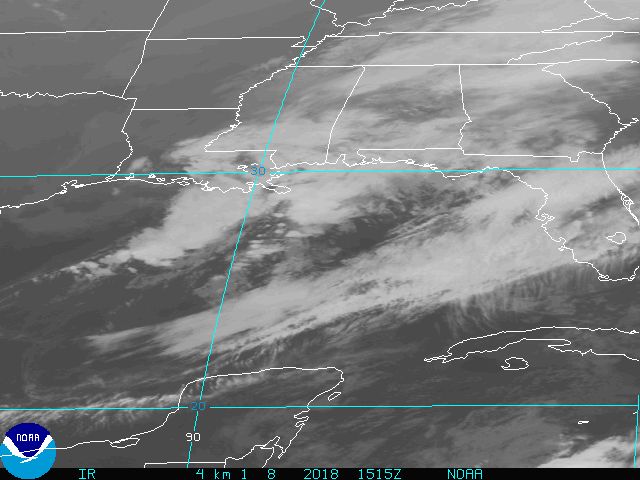
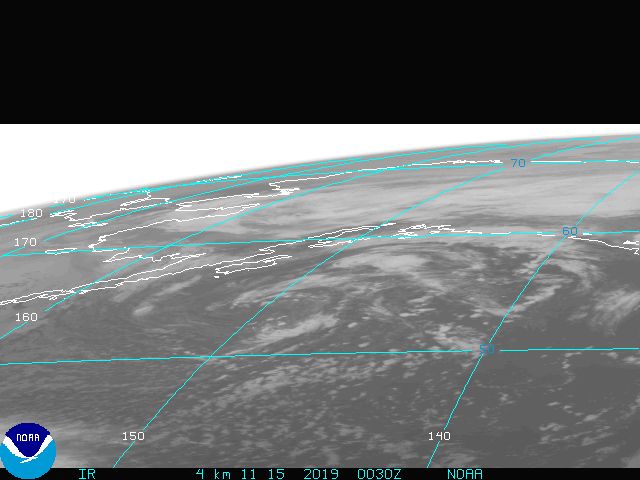
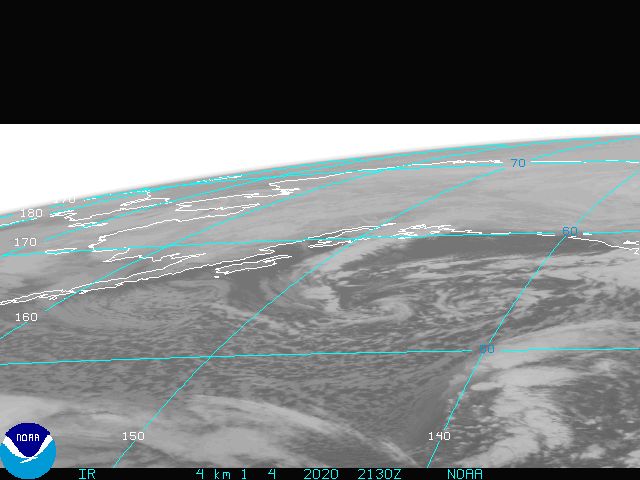
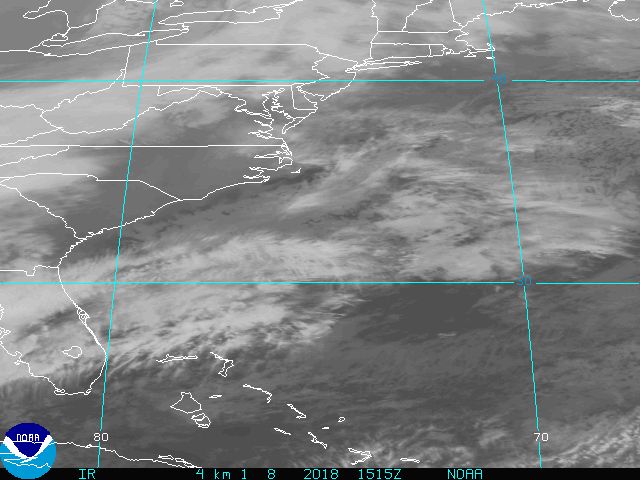
Satellite
Images
GOES
Northern Hemisphere Composite IR Image
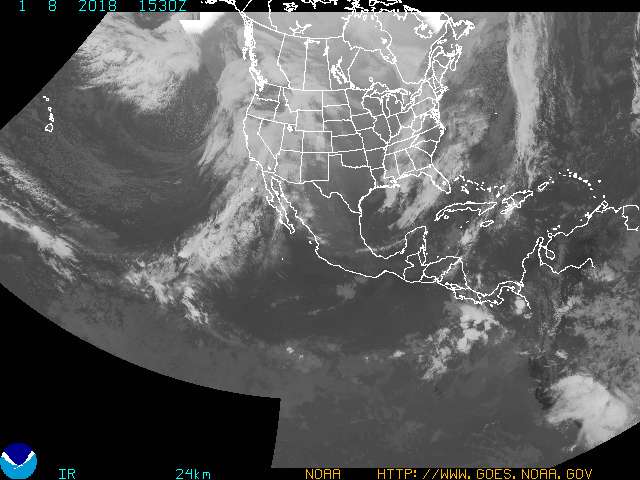
.
GOES
Northern Hemisphere IR Image
GOES Northern
Hemisphere Composite IR Image
GOES
Northern Hemisphere Visible Image
GOES
Northern Hemisphere Water Vapor Image
GOES
East Full Disk Infrared
GOES
West Full Disk Infrared
GOES
Tropical Sector Images
Source: Geostationary
Satellite Server, National
Environmental Satellite, Data, and Information Service
(NESDIS), NOAA. Both single images and looped images available.
NOAA/NESDIS
North America Infrared Image

GOES
Eastern US IR Image
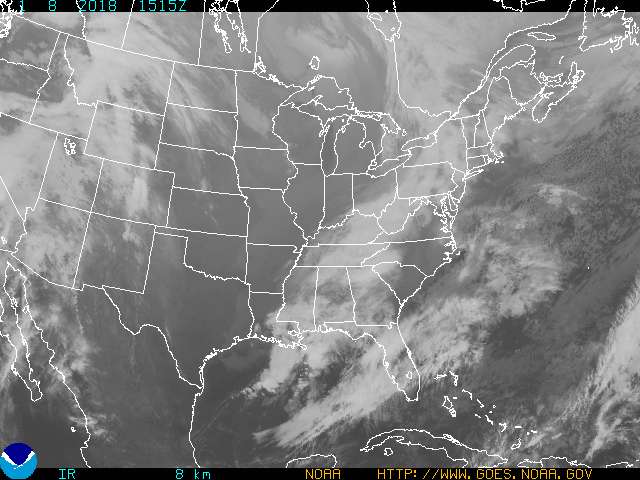
See
also: GOES
Western US IR Image
GOES
East 1 km Infrared Weather Satellite Image
SE
US – Infrared

Source:
Aviation
Weather Center, NCEP,
NWS
NOAA/GOES Severe Weather Infrared Images
East Coast
| Florida
| Gulf of
Mexico |
Gulf Coast |
Montserrat
Source:
Severe
Storms and Special Events
Other
NWS Satellite Products
Visible
Satellite, SE US
Water
Vapor Satellite, SE US
SE
US Infrared Satellite Loop
Go To Top
GOES
Eastern US Water Vapor Image
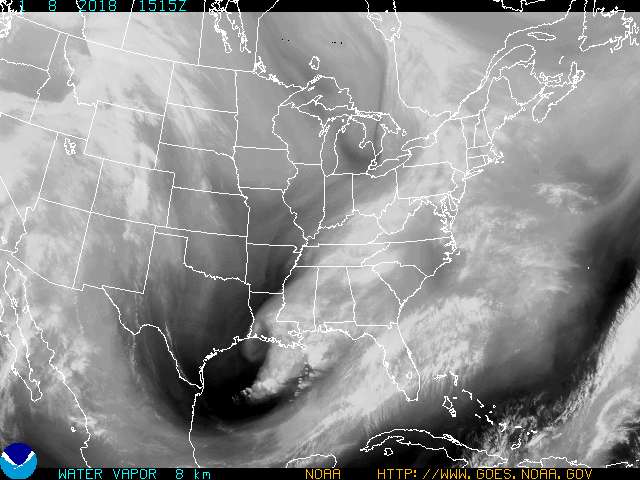
NOAA/NESDIS North America Water Vapor Image

Water
Vapor – Southeast

Additional
Interactive
Global Geostationary Weather Satellite Images, Earth Science
Office, Marshall
Space Flight Center, Huntsville, AL.
Provides the ability to “drill in” into images, including
color-coded infra-red.
Satellite
Services Division, NOAA. Comprehensive resource for satellite
products.
Satellite
Images and Products, Huntsville WFO,
NWS.
Regional and National - Visible, Infrared and Water Vapor (both
still images and loops), plus:
Lifted
Index
|
CAPE
|
Convective
Inhibition
(CINH
)
|
Precipitable
Water
GOES
Sounder
Temperature and Moisture Products is another comprehensive
resource.
Go To Top
Surface
and Upper Air Maps
RAP
Real-Time Weather Data
The National Center for Atmospheric
Research (NCAR)
Operated by the University Corporation of
Atmospheric Research
250
mb Upper Air Map

Northern
Hemisphere and North
America, Jet
Stream Analyses and Forecasts at 300mb
US
Wind Speeds, WeatherPlus | Current
300 mb Streamlines Plot, Unisys | 250
mb Plot, Unisys
Southeast
Jet Stream Contour (WAAY-TV) | Southeast
Wind Speed Contour (WAAY-TV)
300mb
Contours, Isotherms & Data, American
Meteorological Society
An
upper level chart. Note the location of low pressure areas, troughs
and ridges, and whether we are above or below the main flow of the
Jet Stream. Horizontal divergence and convergence may influence
surface conditions. Convergence is where the upper level winds are
coming together; divergence is where the upper level winds are being
split. In both cases, atmospheric lift can result, enhancing
convective activity.
[As
appropriate, insert Southeast
Jet Stream Contour from WAAY-TV, Huntsville, AL]
500
mb Upper Air Map

Source:
RAP
Real-Time Weather Data
Take
particular note of the 540 line (corresponds roughly to freezing at
sea-level).
See also: 500
mb Plot, Unisys
Daily
Weather Map, Department of Commerce
500mb
Contours, Isotherms & Data, American
Meteorological Society
An
upper level chart. Note the location of low pressure areas,
shortwaves (e.g., "upper level impulses"), troughs and
ridges and vorticity lobes. What is the direction and force of
steering winds?
700
mb Upper Air Map

Source:
RAP
Real-Time Weather Data
700
mb Plot, Unisys
700mb
Contours, Isotherms & Data, American
Meteorological Society
A
Low Level chart, look for troughs and shortwaves, as well as ridges.
Some thermal advection can also be seen on the 700 mb chart. Some
also display vertical velocity (rotation). Check the location of the
540 line.
850
mb Upper Air Map

Source:
RAP
Real-Time Weather Data
850
mb Plot | 925
mb Plot, Unisys
Additional Surface and Upper Air Maps are
available from Unisys, Mandatory
Plot Levels,
850mb
Contours, Isotherms & Data, American
Meteorological Society
and
the National Weather Service, Surface
and Upper Air Maps
Temperatures
below 0° (the blue line) on the 850mb chart probably indicate
snow, etc., while precipitation at temperatures above 0° C will
fall as rain. This chart can also help identify cyclogenesis, thermal
advection and dynamic lifting or sinking (WAA & CAA). Increases
in thickness may signal improving weather.
Unisys 4-panel NGM MOS
plots (12, 24, 36, and 48 hour forecasts; temperature, convection,
dew points and winds):
Surface
1000
850
700
500
300 plus
Relative Humidity & Lift
(other forecast models also available)
Unisys Single-panel
“Initial” NGM MOS Plots (temperature, convection, dew points
and winds):
Surface
1000
850
700
500
300,
plus the
850-500
mb Relative Humidity & Lift plot (other forecast models also
available)
Surface
and Upper Air Maps, Storm Prediction Center
Go To Top
National
Temperatures

Source:
RAP
Real-Time Weather Data, National
Center for Atmospheric Research
(RUC Forecast Model; Eta and
GFS also available for comparison)
Southeast
Temperature Contour (WAAY-TV)
National
Temperatures Map – WeatherPlus.com
Go To Top
National
Dew Points

Source:
RAP
Real-Time Weather Data, National
Center for Atmospheric Research
Southeast
Dew point Contour (WAAY-TV)
National
Dew point Map – WeatherPlus.com
See also: National
Relative Humidity
Southeast
Humidity Contour (WAAY-TV)
Additional Imagery from RAP
Real-Time Weather Data
Wind
speed and surface pressure | Four
Panel Plot |
Theta-E
Index Image
What
temperatures and dew points are being experienced by "upstream"
locations? Is there a Theta-E ridge building?
Go To Top
National
Theta-E Image

Source:
RAP
Real-Time Weather Data, National
Center for Atmospheric Research
The
Theta-E image depicts the combination of temperature and moisture.
Where the two co-exist over a given area, there is a greater chance
for convective activity if a source of lift exists; see Powerful
Lifting Mechanisms, Meteorologist Jeff Haby. Theta-E is also
referred to as "potential temperature." Also see A
Look At TEI (Theta-E) and Potential
Temperature and Equivalent Potential Temperature, also from Haby.
Go To Top
Skew-T
Sounding Chart
Station
KEET
(Birmingham, Shelby County, AL)

SKEW-T
Text
Source:
Upper
Air Plots, Unisys.com
Other
Upper Air Sounding Locations
Regional Skew T Plots
Skew-T
Sounding Charts
from
National Weather Service
I find that some
information on the NWS chart is easier to read, and there is
additional information that is found on those charts that is not
found on the UNISYS chart. On days where severe weather is in the
forecast, I download, save and incorporate the most recent NWS
soundings.
Meters
to Feet Conversion Calculator (Source: unitconversion.org)
GOES
Satellite Sounding - Huntsville, AL

SKEW-T
Sounding Image for Huntsville, AL - GOES
Microwave
Profiling Radiometer (MPR) Sounding
University
of Alabama Huntsville
Note: no listing of numeric values.
See
generally NOAA
Ground-Based
Radiometers, NOAA
Ground-Based
Passive Microwave Profiling during Dynamic Weather Conditions
Op40
Sounding SKEW-T for KDCU, Decatur
Source: Forecast
Research Branch, NOAA
MAPS
Skew-T Sounding Chart
and
RUC2
Skew-T Sounding Chart, Station KDCU, Decatur, AL
Source: Rapid
Update Cycle (RUC), Earth System Research Laboratory, NOAA
Upper
Air Sounding (Radiosonde) Locations from Decatur:
At
approximately
360
Miles | At
720
Miles | At
1080
Miles | At
1440
Miles
Upper Air
Cross-section Analysis:
Albuquerque,
NM/Nashville, TN
Del
Rio, TX/Tallahassee, FL
(College of DuPage)
GOES
Sounding Map for United States
SE
US GOES Satellite Soundings Locations
Tennessee
GOES Satellite Soundings Locations
Alabama
GOES Satellite Soundings Locations
Mississippi
GOES Satellite Soundings Locations
Missouri
GOES Satellite Soundings Locations
Arkansas
GOES Satellite Soundings Locations
Louisiana
GOES Satellite Soundings Locations
Nebraska
GOES Satellite Soundings Locations
Kansas
GOES Satellite Soundings Locations
Oklahoma
GOES Satellite Soundings Locations
Texas
GOES Satellite Soundings Locations
GOES
Lifted Index, Mid Atlantic Sector
GOES
CAPE Index, Mid Atlantic Sector
GOES
Convective Inhibition (CINH), Mid Atlantic Sector
GOES
Precipitable Water, Mid Atlantic Sector
GOES
Satellite Sounding, Huntsville, AL (SKEW-T)
GOES
Atmospheric Soundings Display
GOES
Sounder Temperature and Moisture Products
GOES
Sounding Map of the US
Complete
Station List
General
Information
High
Resolution GOES Maps
Southeast
| Mississippi
Valley | Gulf
Coast | Northern
Plains | Central
Plains | Texas
Source
for GOES Date:
National
Environmental Satellite, Data, and Information Service
(NESDIS),
NOAA
Important
Note: GOES satellite soundings are available only when sky conditions
are clear or partly cloudy.
In cloudy conditions, or when GOES
sounder data is missing, a message 'Sounding Unavailable' will be
displayed.
As a result, these readings may be unavailable where
the worse weather is occurring.
Convective
Indices, St. Louis, MO WFO, National Weather Service
RUC
12-hour Forecasts of CAPE/CIN
|
Moist-Conv/LI
|
Helicity
|
Theta-E
Discussions
of the contents of a SKEW-T diagram:
UNISYS,
Upper
Air Sounding Details
NWS, Explanation
of SPC Severe Weather Parameters
Jeff Haby, Getting
To Know SKEW-T Parameters
and
Forecasting
Severe Weather Using SKEW-T
Charts
and Calculators
Celsius
to Fahrenheit | Meters
To Feet | MM
to Inches | Knots
to Miles Per Hour
Weather
Conversion Calculators (NWS Boston)
Skew-T
Questions
Questions concerning
values displayed on the SKEW-T graphic that expand understanding of
the stability of the air mass over this area, together with its
potential for severe weather:
Sounding variables and indices
Y
/ N -
L57 Lapse Rate: Greater than 5.5°
C/km?
greater than 6.7°
C/km?
Y
/ N - Is the Theta-E
Index greater than 5? Greater than 8?
Y
/ N - Lifted Index (LI):
Less than -4? Less than -8?
Y
/ N - Showalter Index
(SI): Less than -4? Less than -8?
Y
/ N - Total Totals Index
(TT): Greater than 53? Greater than 56?
Y
/ N - K Index (KI):
Greater than 26? Greater than 40?
Y
/ N - SWEAT Index
(Severe Weather Threat Index): Greater than 300? Greater than 400?
Y
/ N - Energy Index (EI):
Less than 0? Less than -2?
Parcel Indices
Y
/ N -
CAPE ( Convective available potential energy): Greater than 1,500?
Greater than 2,500?
Y
/ N -
CINH (Convective inhibition): Greater than 51? Greater than 200?
Y
/ N -
CAP: (Cap strength): Greater than 2.0? Greater than 4.1?
Y
/ N -
Super-adiabatic lapse rate – where the temperature decreases
with height – at a rate of greater than 10 degrees Celsius per
kilometer? (data is displayed on the NWS
Skew-T
Sounding Charts
in
the lower left corner)
Wind Parameters
Y
/ N - HEL (Storm
relative helicity): Greater than 300? Greater than 400?
Y
/ N - EHI
(Energy-Helicity Index): Greater than 1? Greater than 5?
Y
/ N - BRN (Bulk
Richardson Number): Less than 45? In the teens?
Y
/ N - Upper level winds
(between 500 and 300 mb level) of greater than 100 knots?
Y
/ N - Low level winds
(850 to 700 mb) at 25 knots or greater?
Y
/ N - Atmospheric winds
increasing at higher
levels (upper level
speed shear greater than 70 knots)?
Y
/ N - Atmospheric winds
from different directions
(directional shear of 60 degrees or
more from the surface to 700 mb)?
Current Surface
Conditions
Y
/ N - Dew Point greater
than 55 degrees?
Y
/ N - Temperature
greater than 80 degrees? In the forecast? - Y
/ N (High temperature
and high dew point indicates high instability, increasing the threat
of severe weather.)
Y
/ N - Relative Humidity
(RH): Greater than 50%? Greater than 80%?
Y
/ N -
Is there a 30 to 50 degree surface temperature/dew point spreads?
(High microburst potential.)
When
these values indicate the potential for severe weather, or where
there is some questions about the values displayed on the graphic, I
bring up the Text
version
of the SKEW-T and check the appropriate values.
PDF
version of the above questions:
SKEW-T_Questions
Note:
I've acquired these questions from numerous sources, believed to be
reliable.
If this is not the case, please contact me at w4dda at
arrl dot net. Thanks!
Pryor
Field, Decatur, AL - Current
Conditions
|
Meteogram
|
Text
Archive
Current
Conditions-Willow Place
KALDECAT4
| CW7715
| AWEKAS
| CoCoRaHS
| CHARM
.
KDCU,
Pryor Field, Decatur, AL
Note: Standard Atmosphere (average sea-level
pressure) is 1013.25 millibars or 29.92 inches.
My Personal Weather Station:
KALDECAT4
Go To Top
Mesoscale
Analysis
Page
Source:
Mesoscale
Analysis Page,
Storm Prediction
Center (SPC), NCEP,
NWS
National |
NW |
SW |
N Plains |
C Plains |
S Plains |
MW |
NE |
EC |
SE
The SPC writes that "These 10 fixed sectors can be used to see
regional gridded mesoanalysis data across the United States. This information is
provided by SPC as a way of sharing the latest severe weather diagnostic
techniques with local forecasters." See:
Explanation
of SPC Severe Weather Parameters for
more information about the mesoscale analysis page and a detailed
description of the parameter fields.
Go To Top
Mesoscale
Discussion

Source:
Mesoscale
Discussion Page, Storm
Prediction Center (SPC), NCEP,
NWS
Mesoscale
Storms are weather systems smaller than synoptic-scale
systems but larger than storm-scale
systems. Horizontal dimensions generally range from around 50 miles
to several hundred miles. Squall
lines, MCCs,
and MCSs
are examples of mesoscale weather systems. (Source: NWS
Glossary)
When
conditions appear favorable for severe storm development, the SPC
issues a Mesoscale
Discussion (MCD), normally 1 to 3 hours before issuing a weather
watch. The MCD describes what is currently happening, what is
expected in the next few hours, the meteorological reasoning for the
forecast, and when/where SPC plans to issue the watch (if dealing
with severe thunderstorm potential).
Go To Top
Watch,
Warning and Advisory Map
Source:
Storm Prediction
Center, NCEP, NWS
Southeast US Watches & Warnings,
College of DuPage NexLab
Weather Site
Weather Warnings, updated every minute from
Coast to
Coast Weather
Recommendation: run in a separate browser
window during strong/severe weather.
Go To Top
Convective
Outlook, Day 1
Source:
Storm Prediction
Center, NCEP, NWS
If
there is a notation "See Text," refer to the text messages
at the Day
One Convective Outlook. Convective Outlooks are also available
for Day
Two, Day
Three, and Days
4-8. The above graphic is the 2000 UTC update; more recent
graphics may be available at Convective
Outlook, Day 1
Probabilistic
Convective Outlooks
SPC
Probabilistic Tornado Outlook
SPC
Probabilistic Wind Outlook
SPC
Probabilistic Hail Outlook
Go To Top
Thunderstorm
Outlook

This
forecast is good for the next 12 hours,
as of the date and time indicated on this graphic. For longer range
forecasts, consult your local National
Weather Service office web site or other reliable media outlets.
Source:
Thunderstorm
Forecast, The
Weather Channel
See
also: Weather Underground Interactive
Tornado Map of Recent Storms and
U.S.
Severe Weather Map,
Weather
Underground
Also for my area: Southeast
Severe Weather Map.
National Weather Service's
Enhanced
Resolution Thunderstorm Outlooks
Storm Prediction
Center, NCEP, NWS
Go To Top
Atlantic
Tropical Cyclone Activity

Source:
National
Hurricane Center, Tropical Prediction Center, NCEP, NWS
Blank
Atlantic Tracking Chart
West Atlantic
Satellite Images
Additional
Hurricane-related resources from the NESDIS and the NWS:
Tropical
Cyclone Maps from WeatherPlus.com:
The
Loop Current -
MGSVA
Three-Month Plot
Other
National Weather Service Offices
Coastal
Water Temperature Tables, National Oceanographic Data Center (NODC)
Gulf of
Mexico:
Eastern Coast |
Western
Coast
Go To Top
National
Forecast Map
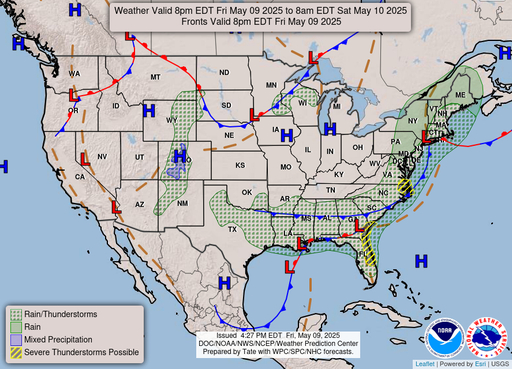
Source:
Hydrometeorological
Prediction Center, NCEP, NWS
Storm
Prediction Center Graphical Forecast (f000-f087)
National Forecast
Model Maps
National Weather Service
Short Range
24
hour -
48 hour
Medium Range
Day 3 -
Day 4 -
Day 5 -
Day 6
Weather -
Model Outlook
Short
Range Forecast Discussion
Extended Forecast Discussion
Map
of North American Continent (with longitude and
latitude), WorldAtlas.com
Wind
Speed Converter, NWS
Temperature
Conversion, NWS
24
Hour Fronts, Pressure and Weather Forecast
48
Hour Fronts, Pressure and Weather Forecast
Day
3 Medium Range Forecast
Seven
Day Loop
24-Hour
NAM 4-Panel Plot
and "Miscellaneous
Plots"
(CAPE, Helicity, EHI, Precipitation, Snow), Unisys
Meteorological
Analyses over North America (All Panels)
The latest NAM
analysis issued by the National Centers for Environmental
Prediction; Key
to Panels
1. 200mb
Streamlines & Isotachs
2. 500mb
Geopotential Height & Vorticity
3. 700mb
Vertical Velocity
4. 850mb
Temperature, Humidity & Wind
5. Sea
Level Pressure & 1000-500mb Thickness
6. Convective
Available Potential Energy & Precipitable Water
GOES-13 Sounder Derived Product Imagery including Clouds, Fire, Moisture, Severe Weather, and Temperature products.
Map
Rooms: e-Wall-Penn
State | Map
Wall II-Penn State | Contiguous
United States Map Room-Jeff Haby | Map
Wall Photo-Penn State
National
forecast maps include: Weather
Underground |The
Daily Weather Map |Unisys
|University
at Albany
Several
weather forecast models:
Model
Output Statistics
(contour
plots of weather forecast data) from
Unisys
Weather Services:
NGM
Model
|
NAM/Eta
Model |
GFS/Avn
Model
|
GFSx/MRF
Model
|
RUC
Model
|
ECMWF
Model
Model
Analysis and Forecasts, National Centers for Environmental
Prediction, National Weather Service
Current
MOS Forecast Products, NWS
Rapid
Update Cycle (RUC) (12-Hour Forecast Graphics)
NCEP/HPC
Forecasts: 24-hour
forecast | 36-hour
forecast | 48-hour
forecast
Canadian
Meteorological Centre (CMC): Canadian
Weather | Weather
At A Glance | 24
Hour Forecast | Analysis
and Modeling
Instituto
de Meteorología, Cuba
Servicio
Meteorológico Nacional, Mexico
UK
Met Office: UK
Forecasts | Europe
Weather | World
Weather
European
Centre for Medium-Range Weather Forecasts (ECMWF):
Forecast
Products (most links require higher credentials) | Deterministic
Forecast | North
American Wind 850 and MSLP Forecast | NOAM
Geopotential 500 mPa | Northern
Hemisphere Wind 850 and MSLP Forecast | Northern
Hemisphere Geopotential 500 mPa
World
Meteorological Organization: World
Weather Information Service | North
and Central America | Severe
Weather Information Centre | National
Meteorological Centers
6-10
Day Outlook for Precipitation and Temperature, NWS Climate
Prediction Center
Clouds
– RUC 12-hour Forecast: Below
6,000 ft | 6,000
– 12,000 ft | 12,000
– 18,000 ft | Above
18,000 ft. Note: the default is to the RUC model. Other models
also available. Source: RUC
Model Plots, RAP Real-Time Weather Data, The National Center for
Atmospheric Research (Operated by University Corporation for
Atmospheric Research).
Two
surface analysis forecast loops: USSATSFC
& RADSFCUS
Final
Extended Forecast Discussion & Additional
Forecast Discussions, The Hydrometeorological Prediction Center
(HPC)
Rules
for Finding Fronts, Professor Paul Sirvatka, College of DuPage
COLA
Weather and Climate Data, Center for Ocean-Land Atmosphere
Interaction (COLA)
Includes Analyses of
Current Conditions, Weather Forecasts, Metropolitan Meteograms,
Short-Term Climate Outlooks, and Maximum Potential Hurricane
Intensity
Physical
Sciences Division, NOAA Earth System Research Laboratory
PSD Map Room weather products include Surface, Upper Air, Satellite
and Radar plots compiled from numerous sources.
Go To Top
Quantitative
Precipitation Forecast
24
Hour Precipitation Total - Day 1

Source:
Hydrometeorological
Prediction Center, NCEP, NWS
Day
2 Precipitation Forecast | Day
3 Precipitation Forecast
Precipitation
Forecast Loop
NWS Hourly Precipitation Analysis (Experimental)
Other Precipitation Forecasts and Resources:
Quantitative
Precipitation Forecasts,
HPC, NOAA
24
Hour Precipitation Totals (Valid 12Z-12Z)
Quantitative
Precipitation Forecast Discussion
Local
CoCoRaHS Observations,
Huntsville Office, NWS
Norman Junker, HPC,
Introduction
to Various QPF Techniques
Go To Top
Huntsville
Weather Forecast Office
Graphical
Forecast for the Southern
Mississippi Valley
Additional
Imagery
GOES
Eastern Visible Image
GOES
Eastern Infrared Image
GOES
Eastern Water Vapor Image
Source:
GOES
Geostationary Satellite Server
SE
US Visible Satellite
SE
US Infrared Satellite
SE
US Water Vapor Satellite
Source:
Aviation
Weather Center, NOAA
Southeast Satellite Images - Current
Plots (previous plots available back to -6 hours)
Surface
| Radar
|
Infared |Enhanced
Infared |Visible
Source: Unisys
Satellite Images
Weather Models and
Forecasts
Go To Top
Local
Forecast Text Products
The
7-Day Forecast for Priceville
Short
Term Forecast (The
6-Hour NOWCAST).
Not issued during fair weather.
Access during inclement weather; carefully check the date and time.
Severe Thunderstorm Warning
Severe Weather Statement
Special
Weather Statements
Storm
Reports
Hazardous
Weather Outlook (HWO)
Area
Forecast Discussion (AFD)
Current
Watches, Warnings and Advisories for Counties
in northern Alabama
Additional
Resources:
Severe/Hazardous
Weather,
Huntsville
Office, National
Weather Service. One-stop shopping during inclement weather. See
also: On-line
Weather Products - Listing and Links.
-
Weather - Model Outlook
Storm
Prediction Center, National Weather Service: Watches,
Mesoscale
Discussions, Outlooks,
All
Products
The
Nexlab Alabama Weather Page , Up-to-the-minute weather text
products for Alabama from the College of DuPage. Excellent
resource.
Alabama
Weather Page, Alabama Office of the State Climatologist;
numerous products available.
National
Space Science and Technology Center, University of Huntsville.
24-Hour
NAM 4-Panel Plot,
Unisys.
Miscellaneous
Severe-Weather Plots (CAPE,
Helicity, EHI, Precipitation, Snow), Unisys.
Weather
at 24 Willow Place, Decatur, AL
Current
Conditions-Willow Place (My
Local Page)
Conditions and Forecast - Pryor Field, Decatur, AL
KALDECAT4
| CW7715
| PWS Weather
|
Cumulus
|
Cumulus Real-time |
CoCoRaHS
| CHARM
METAR
Data (for
Station KEET, Alabaster, AL) from Aviation Digital Data Service
(ADDS)
At
any time of year, severe storms can damage trees.
The
Arbor Day
Foundation offers a Storm
Recovery Kit to help you make the best decisions about repairing
and saving trees.
Avoid
scam artists. Check here first
before hiring anyone to help you assess or repair trees.
References
-
Acronyms
and Glossary at JetStream –
Online
Weather School at the Southern Region Headquarters of the National
Weather Service; an excellent educational and research resource.
-
A
Comprehensive Glossary of Weather Terms for Storm Spotters,
Norman WFO, NWS
-
Weather
Glossary at Fort Worth-Dallas WFO
-
Abbreviations
and Acronyms, HPC
-
American
Meteorological Society Glossary
-
World
Meteorological Organization - Acronyms
-
Unit
Conversion Org - online unit converters of length, weight,
volume, area, and more.
-
Meteorological
Conversions and Calculations,
HPC, and Meteorological
Calculator, St. Louis WFO, NWS
As
needed, here is a listing of 21 additional
Weather
Glossaries.
Go To Top
Other
Local Severe Weather Day Resources
National Weather Service on-line storm
spotter training is available:
SKYWARN Spotter Training.
Local WFO offices also conduct training in the communities they serve.
For more information about training in Northern Alabama, see:
SKYWARN Storm
Spotter Information
Emergency
Resources
Know
your enemy! —
that
is, what are the threats that you and your family will face in your
area? Then make a plan, prepare a disaster kit, and be prepared to
take appropriate action as directed by your local emergency
management agency. If ordered to evacuate, do not delay. Flood waters
can rise with great speed. About 60% of all
flood
deaths
are
people in vehicles that were swept away by moving water, including
children who were passengers. The next flood can always be bigger
than floods you have seen before; 100-year floods can occur every
year.
History's
lesson is clear: those who are prepared are more likely to survive,
and those who are not prepared are the least likely to survive (this
includes those who are disabled, overweight or have mobility issues).
This
is an issue of personal responsibility. It's not the government's job
to save me or my family. It is my
job
as a responsible adult to take all steps necessary to protect me and my
family in an emergency.
It
is unrealistic to expect that any level of government will be able to
step in and save me and my family in the event of a catastrophic
emergency. Some storms will be so severe that local governments will
be unable to rescue citizens in immediate danger or provide emergency
food or water. If I ignore a mandatory evacuation order, I will be on
your own until after the storm passes, flood waters have subsided,
and roads have been cleared. This could be days, a week, or more, and
if I haven't put aside extra food and water, my family and I will be
getting very hungry and thirsty.
In the past, the
recommendation has been for three day's supply of food and water. Based on
recent weather emergencies, a three day supply is not enough; one week's supply
might be enough, but two weeks is better. In some publications, I've seen
recommendations of up to a four week supply of food and water (as well as
other needed survival equipment and supplies; see below). Severe weather events
can damage power supplies, water supplies, and create "islands" of neighborhoods
and towns surrounded by impassible storm debris or damaged roads. Whatever
supplies exist will quickly be sold out; if you are unprepared, you should
expect to go hungry and thirsty ... in the dark. On the other hand, a
well-stocked pantry will sustain you long after your neighbors have run out of
food.
If
the sheriff comes by and tells you either to leave or to put on a
body tag, then you've had fair notice. Likewise, if the National
Weather Service says that people who ignore evacuation notices “will
face certain death,” then you've had fair notice.
During
Hurricane Ike, I heard an telephone interview on television with a
woman on the Texas coast who said that she was trusting in God to
protect her. Due to flooding, she was already cut off from evacuation
routes, and this was more than 15 hours before landfall. She was told
two days before that she was in a danger area. She was told the day
before that she was under a mandatory evacuation order. In short, God
had sent her at least two clear messages to evacuate, which she
ignored. I don't know if she survived; I hope so. Many in her area did not.
First reported as a tropical wave
on Aug. 28, 2008, in its 18-day existence Hurricane Ike took at least
195 lives, directly or indirectly. As of Feb. 4, 2009, 34 people
remained missing. Some debris fields had not yet been searched due to
lack of funds; the death toll could still rise. A
number of deaths were residents who did not leave after the first
evacuation notices were issued, and were unable to leave once rising
waters cut off evacuation routes.
The storm surge was 10-15 feet on Galveston Island, and pushed up to
30 miles inland in Louisiana. Almost every structure on parts of the
Bolivar Peninsula was completely razed from their foundations. It
spawned 29 tornadoes, and was the fourth costliest hurricane in terms
of damage inflicted. The official report is available from the
National Hurricane Center's 2008
Atlantic Hurricane Season web page.
If
God sends you a canoe, get
in and start paddling.
FEMA
home study course: Are
You Ready? An In-depth Guide to Citizen Preparedness
(Course
IS-22)
FEMA’s
most comprehensive source on individual, family, and community
preparedness.
Get
A Kit - Make
A Plan - Be
Informed
Links
Open In A New Window At
ReadyAmerica.Com
Other
National Weather Resources
Anything
Weather
AccuWeather -
AccuWeather
Hurricane Center
California
Regional Weather Server, San Francisco State
University
Intellicast.com
Live
Weather Images
MSNBC
Weather
Unisys
Weather
UM
Weather, University of Michigan
USA
Today Weather
Page
Weather.com
Weather.org
WeatherBonk
WeatherBug
Weather
For You
WeatherPlus,
NBC
Weather
Underground
WeatherUSA.Net
Weekly
Weather and Climate News, American
Meteorological Society
WxUSA
Directories
Yahoo
Weather
Google
Weather
Other
:
About.com:Weather
Educational
Links
Weather
Education and Outreach Resources, National Weather Service;
includes NWS Resources, NOAA Resources, and NWS/NOAA Partners and
Affiliate Resources
Department
of Atmospheric Sciences, Texas A & M University
Penn
State Dept. of Meteorology
Department
of Atmospheric Sciences, University of Illinois at
Urbana-Champaign; Especially helpful is their Weather
World 2010 Project (WW2010)
-
Department
of Atmospheric and Oceanic Sciences, University of
Wisconsin-Madison
Next
Generation Weather Lab, College of DuPage
Atmospheric
Sciences Department, University of Alabama, Huntsville
JetStream
Online School for Weather, Southern Region, National Weather
Service
DataStreme
Atmosphere Training Initiative, the American
Meteorological Society
Jeff
Haby, Weather
Prediction: The Tools of the Educated Weather Forecaster
Jeff
Haby, Ultimate
Weather Education Website
Conversion
Charts and Calculators,
Sources include National
Climatic Data Center
Bufkit
forecast profile visualization and analysis tool kit, NWS
Text
Products
"Is
Today A Severe Weather Day?"
Open
Office / Microsoft
Word
Storm
Spotter Reference Sheet - Huntsville (PDF)
These are not NWS
products. I created them for my personal use in Priceville, Alabama.
Please feel free to copy and adapt to your situation as needed.
SKYWARN
Storm Spotter Information, Huntsville
Office, National Weather Service
Huntsville
Amateur Radio Club
(HARC)
Eva
Amateur Radio Club
(EARC)
Decatur
Amateur Radio Club
(DARC)
North
Alabama Repeater Association
(NARA)
ARRL-Alabama
ARES-Alabama
/
Madison
County ARES
Huntsville-Madison
County Radio Amateur Civil Emergency Service
(RACES)

Scott
& Kimberly Davis - N3FJP & KA3SEQ - www.n3fjp.com
In
addition to WX
Spots,
I also use their WX
Warning Program which I find very helpful in keeping up with
watches and warnings.
Also:
Weather Warnings, updated every minute from
Coast to
Coast Weather
Recommendation: run in a separate browser
window during strong/severe weather.
|
I have no
affiliate or other financial relationship with any of the above
sources.
All links open in a new window at an external
site.
This site has no control over the content of external
sites.
Inclusion does not constitute a recommendation.
This
information is provided "as is."
There is no
warranty for fitness for any purpose.
No weather forecast from
any source can be guaranteed for completeness, correctness or
accuracy.
Use these materials solely at your own risk.
Use
these materials only as a guide to make an informed decision
concerning your conduct.
This site will not be liable for any
damages of any sort resulting from forecasts or severe
weather.
Your sole remedy for dissatisfaction is to cease
using this site.
|
Notes
concerning saving this page.
On potentially severe weather days, I bring up this web page, and
then save it to my hard drive. The purpose is to get copies of that
day's graphics on my hard drive.
I then
open that saved page, and copy and paste the contents into a text
document (it is easier for me to supplement and edit a text document
than a new HTML document).
I have found
that when I re-open a saved web page at a later date, that page will
often look for the current
graphic, rather than the saved
graphic (a function of the "image
source" function in HTML). By immediately copying the saved web
page (including saved graphics) into a text document, I am able to
ensure that I will be able to review all relevant content, graphics
and text, at later dates.
Note:
How
far out west do we need to be looking? The average cold front can
move at about 30 MPH and can cover 720 miles in a day. By way of an
example, the distance from Decatur, AL, to Russell, KS, is 722 mi.
But a fast-moving cold front can travel at 60 MPH and can cover 1,440
miles in a day (and 720 miles in just 12 hours). Again by way of
example, the distance from Decatur to Salt Lake City is 1,424 miles
and to Phoenix is 1,438 miles.
So as
Storm Spotters, we sometimes need to be looking much further west
than we might think. If I am looking at my weather pages at 6 AM, I'd
need to be looking at the Kansas weather maps in order to see a
fast-moving cold front that would arrive at 6 PM and I'd need to be
looking at the Arizona and Utah maps in order to see a fast storm
that could be here in 24 hours.
Mileages
quoted are “air” miles (e.g, “as the crow flies”),
based on a distance calculator located at
http://www.infoplease.com/atlas/calculate-distance.html
Free
JavaScripts provided
by The
JavaScript Source
Go To Top